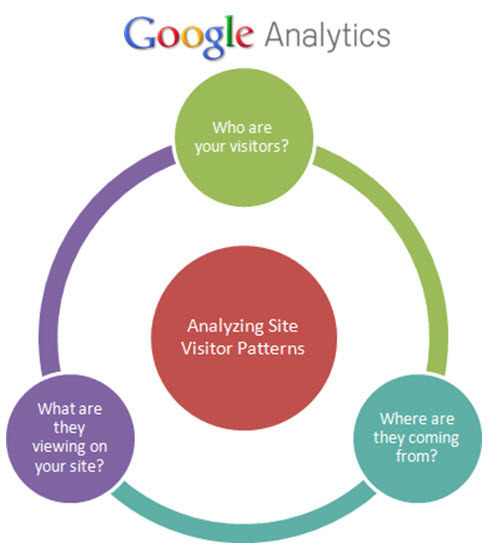
Understanding what action your site visitors are taking and how your site is performing overall, will help you decide new strategies to correct what is causing problems and improve site traffic and user’s experience.
Google Analytics tracks important statistics such as;
- Whether traffic to your site is increasing or decreasing
- Number of website visitors
- What pages on your site are most popular
- What keywords visitors used to search and find your site in search engines
- What pages visitors entered and exited your website
- Which websites sent you the most visitors
- How many visitors completed a required action
- How many visitors are using mobile devices, and much, much, more…
New site owners will see a low number of visitors per day. Traffic is gained over time. After a few months of data you’ll be able to notice trends if you compare date periods in your reports. If traffic is still poor you can improve traffic by running a Google AdWords campaign.
THE REPORTS I THINK ARE MOST IMPORTANT and WHY
Bounce Rate Report
The Bounce rate is the percentage of visitors who, once they land on your website, will not browse your site and they click away immediately. A high bounce rate means the page design doesn’t work or the information is not presented properly. The website fails to attract and engage visitors.
Goals Report
Sales, enquiries, registration and downloads. The most important metric is not necessarily the completion of the goal, but the steps and pages that led to the conversion. By reviewing the click paths of any converted customer you can get a much better idea of what convinced them to take the action you wanted them to. In Google analytics you just need to follow their click path backwards to discover any stumbling blocks.
Average Time on Site Report
Is the information on your page keeping visitors reading and engaged? Are they taking action after this page? Effectively delivering information in two seconds is the key. Users will scan rather than read.
Top Landing Pages
These are the pages visitors land on, before browsing the rest of your website. You can view the browsing path for each webpage and find a pattern and fix any blocks that appear.
Top Exit Pages
These pages failed to generate interest and lead them to exit your website. Revamp these pages to make them “sticky”. You might have a weak “call to action”.
Traffic Sources
This report explains where web traffic is coming from. Visitors may come by typing your website url into their browser, by links to your site from referring sites or from search engines results. If you’re advertising on Google Adwords or anywhere else, the information will help you decide the effectiveness of the outlay of your marketing dollars.
So start interpreting your site analytics! Find out who, why, when and where. The amount of user data will help you make decisions that will have a positive effect on the future success of your site.
Tags: Google Analytics, interpreting analytics, website analysis

 Published
April 2nd, 2011 by
Roslyn Garavaglia
